OpenTelemetry Basics

Oluwadabira Akinwumi
⸱
Software Engineer
Aug 30, 2024
Introduction
If you work with LLM applications and are thinking of taking your application to the next level with LLM observability, then this blog post is for you. We will explore OpenTelemetry, its fundamental concepts, and why it’s important for LLM observability.
OpenTelemetry is a standard method for collecting, processing and exporting telemetry data such as traces, metrics and logs. It is an official open-source project under the Cloud Native Computing Foundation (CNCF). The aim of OpenTelemetry is to deliver a consistent observability solution that will be applicable across languages, platforms, and cloud providers.
When using LLM observability tools, it's important to ensure they follow OpenTelemetry standards to avoid vendor lock-in and to ensure compatibility with a wide range of monitoring and analytics platforms.
This means that if you are unsatisfied with the whatever LLM observability platform you are using, you can easily switch to another platform by migrating your data and not having to worry about data compatibility. By adhering to these standards, you can seamlessly integrate different tools, switch providers if necessary, and maintain a consistent and interoperable observability framework across your entire tech stack.
Open Telemetry signals
The purpose of OpenTelemetry is to collect, process, and export signals. Signals are system outputs that describe the underlying activity of the operating system and applications running on a platform.
In simple terms, OpenTelemetry signals are like different types of "sensors" that help you understand what's happening inside your software or app. Imagine your software is like a car, and you want to know how well it's running. You'd look at things like the speedometer, fuel gauge, and engine temperature to get a sense of how it's performing. In the same way, OpenTelemetry signals provide information about how your software is working.
Lets go over the various type of Open Telemetry signals:
Spans:
A Span in OpenTelemetry represents a unit of work. They can be thought of as the work being done during an operation’s execution. Let’s take CHATGPT for example, every time you ask CHATGPT a question, an OPEN AI api call is made in the backend of the application to answer your question. That single API call would represent a span as it is a single unit of work.
Lets look at an example of an LLM application and identify the OpenTelemetry Signals.
In the code snippet below we are calling an OPENAI api endpoint and initializing Langtrace to trace it. Langtrace is an open-source observability tool that collects and analyzes traces and metrics to help you improve your LLM apps.
We will use Langtrace to monitor the OpenTelemetry signals within our app.
The OPENAI client chat completions .create endpoint represents a single span and if we go to our Langtrace dashboard we can view the corresponding span graph.

In the LLM observability world, operations such invoking a large language model or querying a vector database are spans because they represent a single unit of work.
Traces:
A Trace is made up of a tree of Spans, starting with a Root Span (i.e. Span with no parent), which encapsulates the end-to-end time that it takes to accomplish a task. If you use multiagent frameworks like Crew AI or Langchain you can expect to have traces made up of multiple spans.

Let’s look at an example:
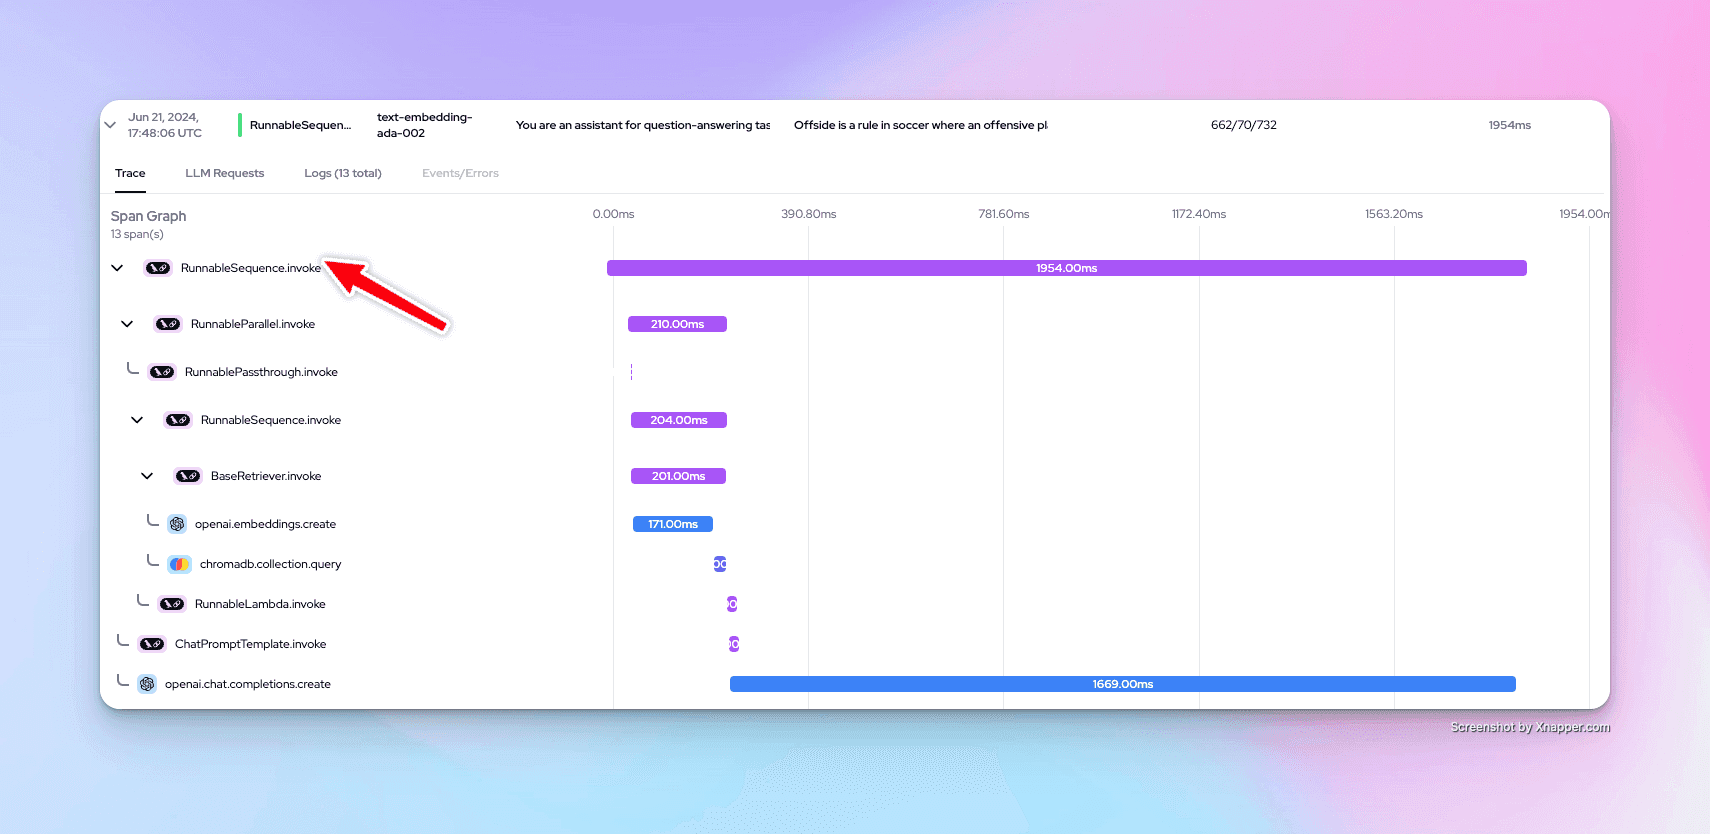
We are going to look at code snippets from a RAG application that uses Langchain. The complete code can in this repo. In the snippet below we can see that our RAG chain will consist of multiple spans. Invoking our chain will be our parent span.
Creating a vector embedding from our documents will be one span. Storing these embeddings in a ChromaDB vector store will be another span. Passing the relevant vector embeddings to our llm to then create a statement will be another span and so on and so forth.
If we run this application and go to our Langtrace dashboard we can see the span graph. As expected invoking our chain is our parent span and we have many other spans within this parent span.
This tree like structure of spans consisting of a parent span is what we call a Trace.
Metrics:
A metric is a measurement of a service captured at runtime. With regards to LLM observability this means capturing information such as the number of input and output tokens, cost of tokens, as well as latency.
All of this information is available to you in Langtrace under project traces.

Conclusion
The ability to view OpenTelemetry signals with Langtrace provides us with comprehensive visibility into our application performance and behavior. The granularity of signals (like traces and metrics) allows for detailed root cause analysis and makes it easy to debug issues in our LLM applications.
Ready to Get the best out of your LLM Models?
Sign up for Langtrace today and start tracing your LLM applications. Don’t ship on just vibes. Make data driven decisions and be more confident in your LLM Applications.
Support Our Open Source Project
If you found this tutorial helpful, please consider giving us a star on GitHub . Your support helps us continue to improve as well as share valuable resources with the community. Thank you!
Ready to deploy?
Try out the Langtrace SDK with just 2 lines of code.
Want to learn more?
Check out our documentation to learn more about how langtrace works
Join the Community
Check out our Discord community to ask questions and meet customers