Observing Langchain applications with Elastic, OpenTelemetry, and Langtrace
Yemi Adejumobi
⸱
Platform Engineer
Sep 3, 2024
By Bahubali Shetti • Karthik Kalyanaraman • Yemi Adejumobi
As AI-driven applications become increasingly complex, the need for robust tools to monitor and optimize their performance is more critical than ever. LangChain has rapidly emerged as a crucial framework in the AI development landscape, particularly for building applications powered by large language models (LLMs). As its adoption has soared among developers, the need for effective debugging and performance optimization tools has become increasingly apparent. One such essential tool is the ability to obtain and analyze traces from Langchain applications. Tracing provides invaluable insights into the execution flow, helping developers understand and improve their AI-driven systems. Elastic Observability's APM provides an ability to trace your Langchain apps with OpenTelemetry, but you need third-party libraries.
There are several options to trace for Langchain. Langtrace is one such option. Langtrace is an open-source observability software that lets you capture, debug and analyze traces and metrics from all your applications. Langtrace automatically captures traces from LLM APIs/inferences, Vector Databases, and LLM-based Frameworks. Langtrace stands out due to its seamless integration with popular LLM frameworks and its ability to provide deep insights into complex AI workflows without requiring extensive manual instrumentation.
Langtrace has an SDK, a lightweight library that can be installed and imported into your project to collect traces. The traces are OpenTelemetry-based and can be exported to Elastic without using a Langtrace API key.
OpenTelemetry (OTel) is now broadly accepted as the industry standard for tracing. As one of the major Cloud Native Computing Foundation (CNCF) projects, with as many commits as Kubernetes, it is gaining support from major ISVs and cloud providers delivering support for the framework.
Hence, many LangChain-based applications will have multiple components beyond just LLM interactions. Using OpenTelemetry with LangChain is essential.
This blog will cover how you can use Langtrace SDK to trace a simple LangChain Chat app connecting to Azure OpenAI, perform a search in DuckDuckGoSearch and export the output to Elastic.
Pre-requisites:
An Elastic Cloud account — sign up now, and become familiar with Elastic’s OpenTelemetry configuration
Have a LangChain app to instrument
Be familiar with using OpenTelemetry’s Python SDK
An account on your favorite LLM (AzureOpen AI), with API keys
App Overview and output in Elastic:
To showcase the combined power of Langtrace and Elastic, we created a simple LangChain app that performs the following steps:
Takes customer input on the command line. (Queries)
Sends these to the Azure OpenAI LLM via a LangChain.
Utilizes chain tools to perform a search using DuckDuckGo.
The LLM processes the search results and returns the relevant information to the user.
Here is a sample interaction:

Here is what the service view looks like after we ran a few queries.

As you can see, Elastic Observability’s APM recognizes the LangChain app and also shows the average latency, throughput, and transactions. Our average latency is 30s since it takes that log for humans to type the query (twice).
You can also select other tabs to see, dependencies, errors, metrics, and more. One interesting part of Elastic APM is the ability to use universal profiling (eBPF) output also analyzed for this service. Here is what our service’s dependency is (Azure OpenAI) with its average latency, throughput, and failed transactions:


We see Azure OpenAI is on average 4s to give us the results.
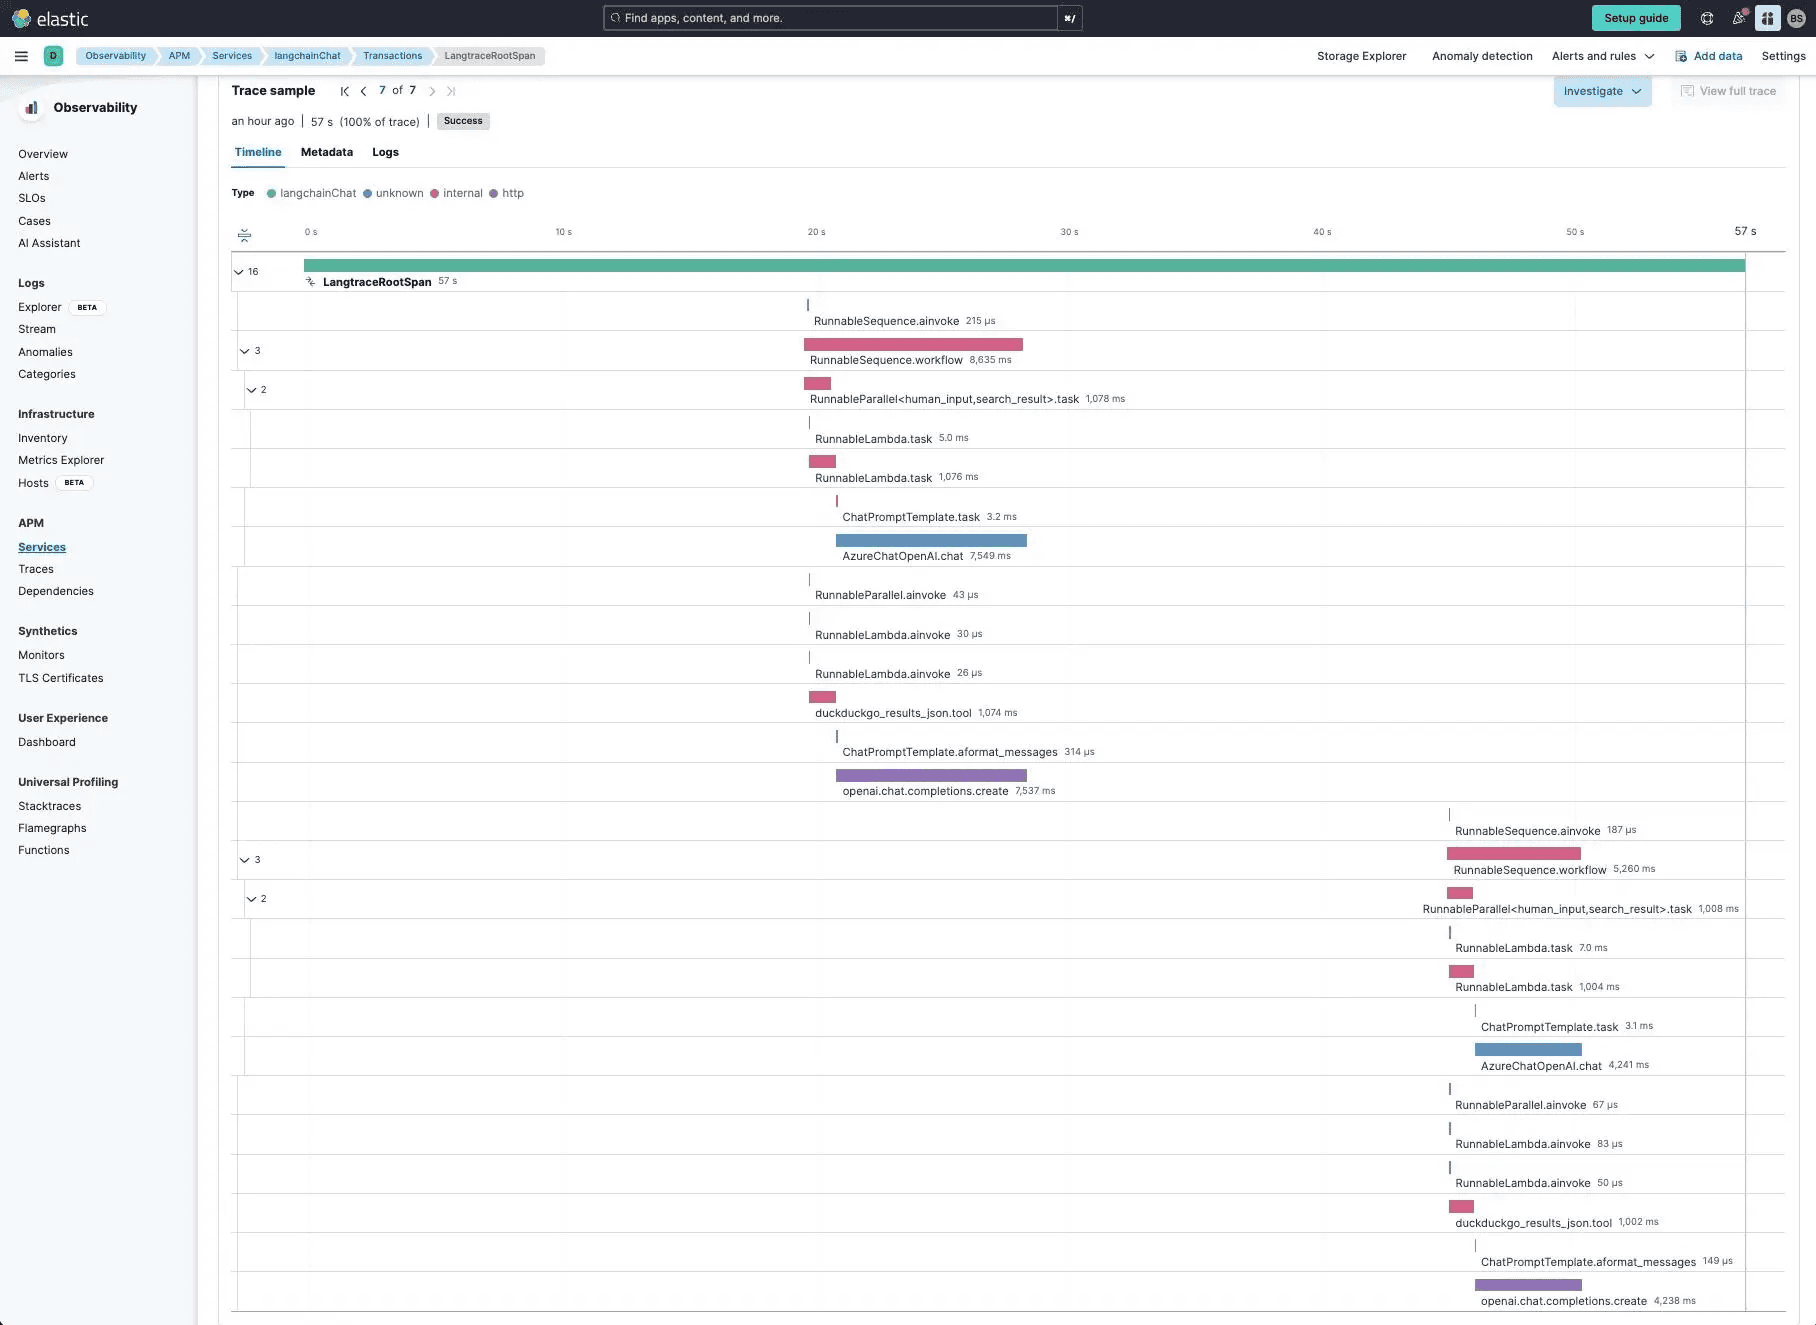
If we drill into transactions and look at the trace for our queries on Taylor Swift and Pittsburgh Steelers, we can see both queries and their corresponding spans.

In this trace:
The user makes a query
Azure OpenAI is called, but it uses a tool (DuckDuckGo) to obtain some results
Azure OpenAI reviews and returns a summary to the end user
Repeats for another query
We noticed that the other long span (other than Azure OpenAI) is Duckduckgo (~1000ms). We can individually look at the span and review the data:

Configuration:
How do we make all this show up in Elastic? Let's go over the steps:
OpenTelemetry Configuration
To leverage the full capabilities of OpenTelemetry with Langtrace and Elastic, we need to configure the SDK to generate traces and properly set up Elastic’s endpoint and authorization. Detailed instructions can be found in the OpenTelemetry Auto-Instrumentation setup documentation.
OpenTelemetry Environment variables:
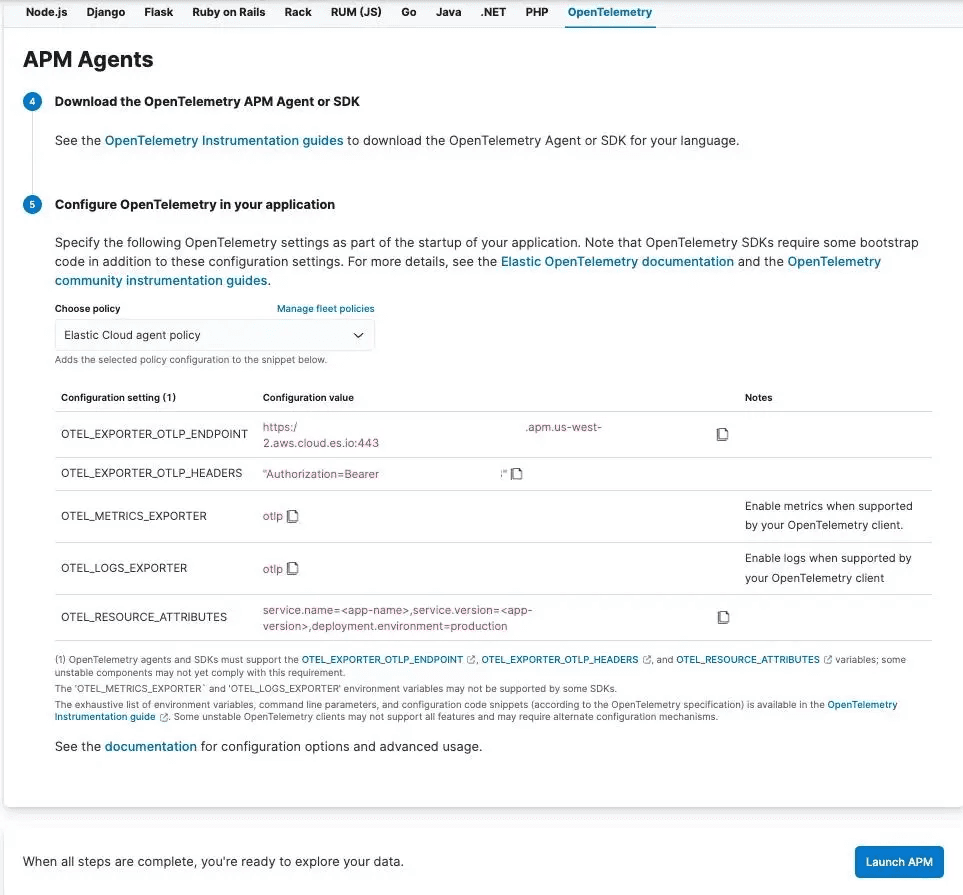
For Elastic, you can set the following OpenTelemetry environment variables either in your Linux/Mac environment or directly in the code:
In this setup:
OTEL_EXPORTER_OTLP_ENDPOINT is configured to send traces to Elastic.
OTEL_EXPORTER_OTLP_HEADERS provides the necessary authorization for the Elastic APM server.
OTEL_RESOURCE_ATTRIBUTES define key attributes like the service name, version, and deployment environment.
These values can be easily obtained from Elastic’s APM configuration screen under the OpenTelemetry section.

Note: No agent is required; the OTLP trace messages are sent directly to Elastic’s APM server, simplifying the setup process.
Langtrace Library:
OpenTelemetry's auto-instrumentation can be extended to trace additional frameworks using instrumentation packages. For this blog post, you will need to install the Langtrace Python SDK:
After installation, you can add the following code to your project:
Instrumentation:
Once the necessary libraries are installed and the environment variables are configured, you can use auto-instrumentation to trace your application. For example, run the following command to instrument your LangChain application with Elastic:
The Langtrace OpenTelemetry library correctly captures the flow with minimal manual instrumentation, apart from integrating the OpenTelemetry library. Additionally, the LLM spans captured by Langtrace also include useful metadata such as token counts, model hyper-parameter settings etc. Note that the generated spans follow the OTEL GenAI semantics described here.
In summary, the instrumentation process involves:
Capturing customer input from the command line (Queries).
Sending these queries to the Azure OpenAI LLM via a LangChain.
Utilizing chain tools, such as DuckDuckGo, to perform searches.
The LLM processes the results and returns the relevant information to the user.
Conclusion
By combining the power of Langtrace with Elastic, developers can achieve unparalleled visibility into their LangChain applications, ensuring optimized performance and quicker debugging. This powerful combination simplifies the complex task of monitoring AI-driven systems, enabling you to focus on what truly matters—delivering value to your users. Throughout this blog,we've covered the following essential steps and concepts:
How to manually instrument Langchain with OpenTelemetry
How to properly initialize OpenTelemetry and add a custom span
How to easily set the OTLP ENDPOINT and OTLP HEADERS with Elastic without the need for a collector
How to view and analyze traces in Elastic Observability APM
These steps provide a clear and actionable guide for developers looking to integrate robust tracing capabilities into their LangChain applications.
We hope this guide makes understanding and implementing OpenTelemetry tracing for LangChain simple, ensuring seamless integration with Elastic.
Additional resources for OpenTelemetry with Elastic:
Modern observability and security on Kubernetes with Elastic and OpenTelemetry
Adding free and open Elastic APM as part of your Elastic Observability deployment
Monitor OpenAI API and GPT models with OpenTelemetry and Elastic
Futureproof your observability platform with OpenTelemetry and Elastic
Instrumentation resources:
Ready to deploy?
Try out the Langtrace SDK with just 2 lines of code.
Want to learn more?
Check out our documentation to learn more about how langtrace works
Join the Community
Check out our Discord community to ask questions and meet customers


