Integrating Langtrace with Elastic APM for Comprehensive LLM Observability

Yemi Adejumobi
⸱
Platform Engineer
May 31, 2024
In today's world of microservices and distributed systems, observability has become a crucial aspect of maintaining and troubleshooting applications. In my conversations with enterprise customers, most prefer to integrate new AI tools into their existing infrastructure rather than adopt entirely new solutions. Langtrace makes this possible in a seamless way.
Langtrace is a powerful, developer friendly open-source tool for adding observability to your AI applications, and Elastic APM is a robust solution for monitoring the performance of your applications. In this blog post, we'll show you how to use Langtrace to send traces to Elastic APM and how to index and query data using LlamaIndex.
The demo project is a Q&A RAG application that leverages Langtrace for observability and LlamaIndex for data indexing and querying. Users can ask questions about the essay, and the system will provide relevant answers by querying the indexed content. This setup provides a practical example of how to integrate AI observability with data indexing and querying in a real-world application.
Prerequisites
Before we get started, make sure you have the following prerequisites:
Python installed (preferably Python 3.7 or higher)
An Elastic Cloud APM account
Download Data
First, we need to download the data files to be indexed into a data directory.
Setting Up the Environment
Let's set up a virtual environment and install the necessary packages:
Creating Your Script
Create a file named main.py and add the following code:
Replace YOUR_LANGTRACE_API_KEY with your actual Langtrace API key if you’d like to send traces to Langtrace Cloud
Configuring OpenTelemetry for Elastic APM
To send traces to Elastic APM, we need to set up some environment variables. These variables configure OpenTelemetry to use Elastic APM as the trace exporter.
Login to your Elastic deployment then click Observability
Navigate to the Integrations tab then APM
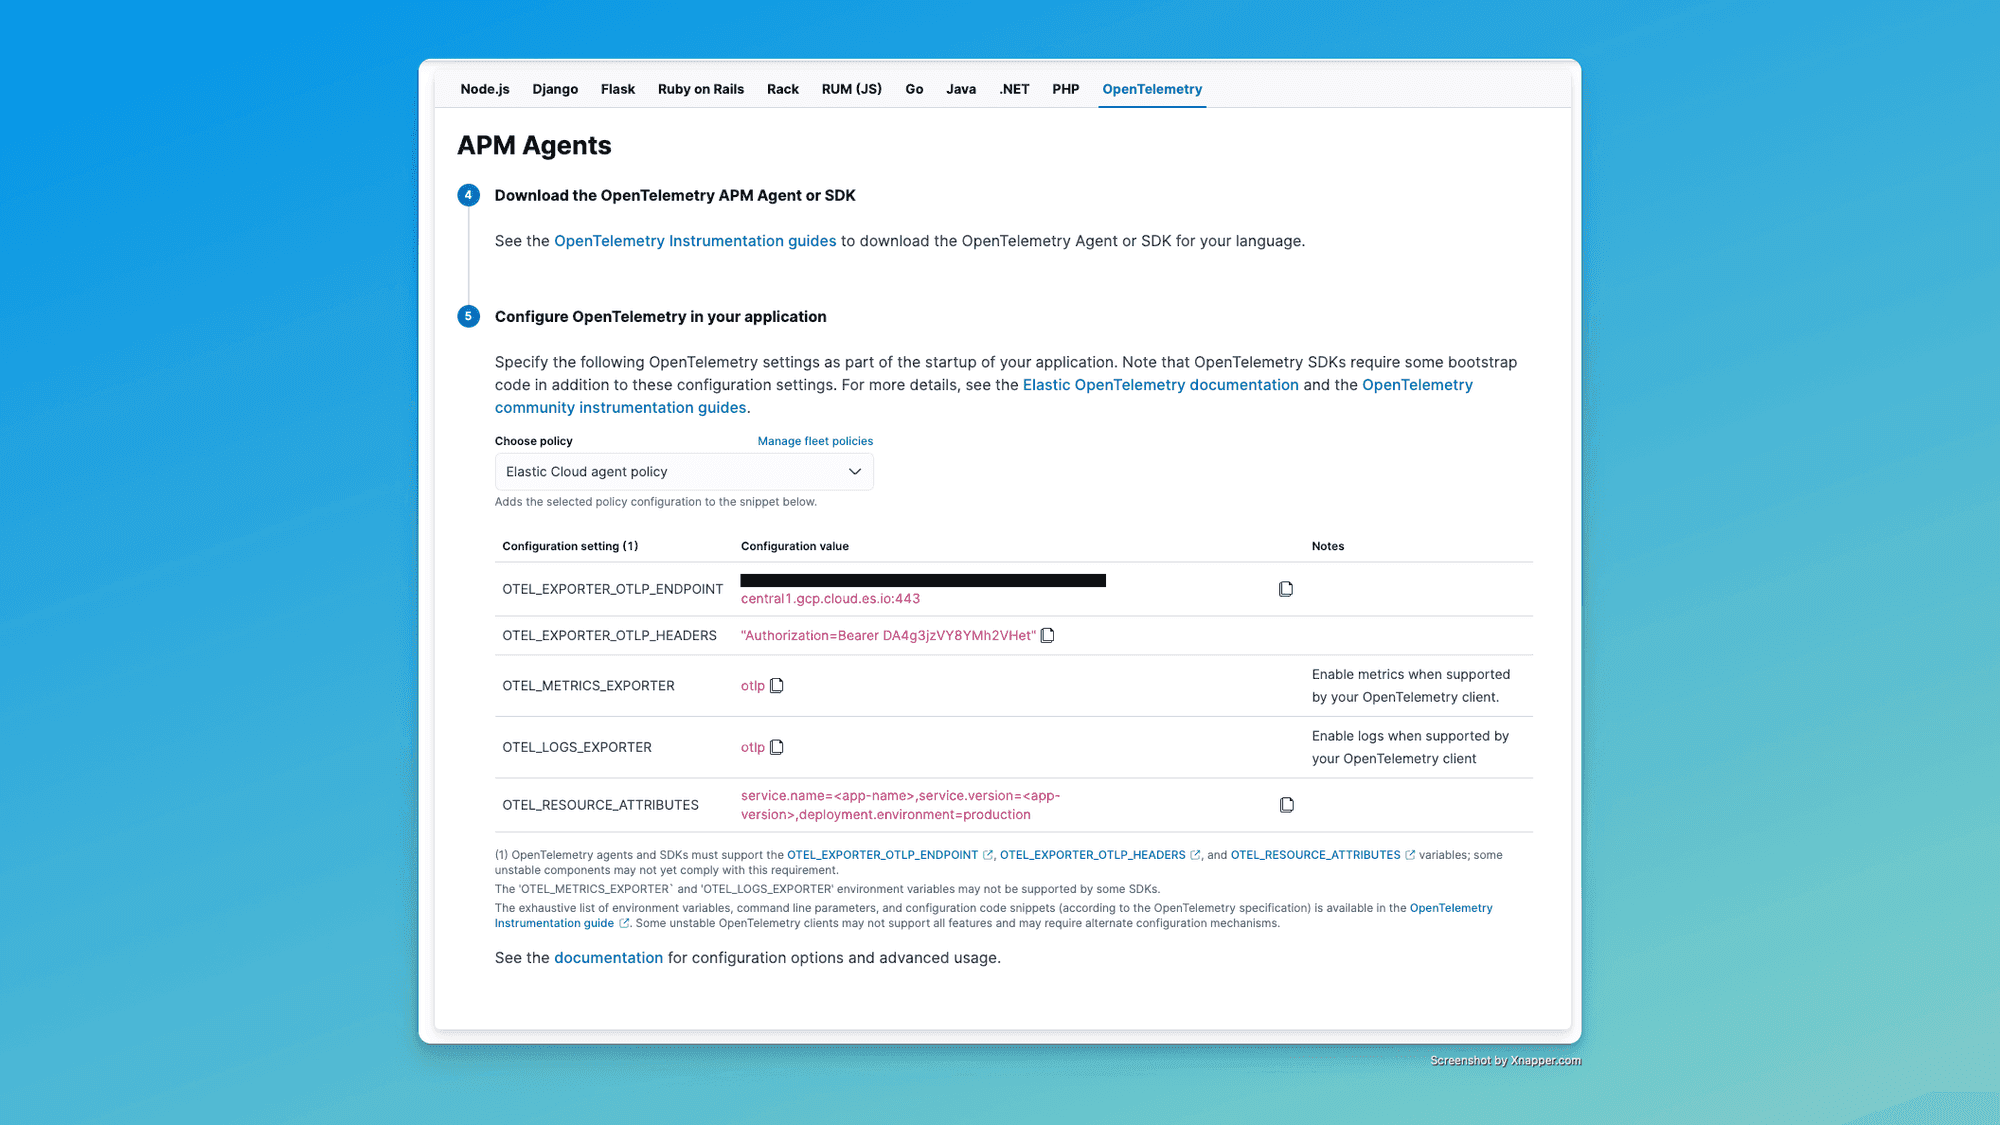
Select OpenTelemetry then set the following environment variables in your terminal:
Replace your-elastic-apm-endpoint and your-elastic-apm-token with your actual Elastic APM endpoint and token.
Running the Application
With the environment variables set, we can now run our application with OpenTelemetry instrumentation. Use the following command: opentelemetry-instrument python main.py
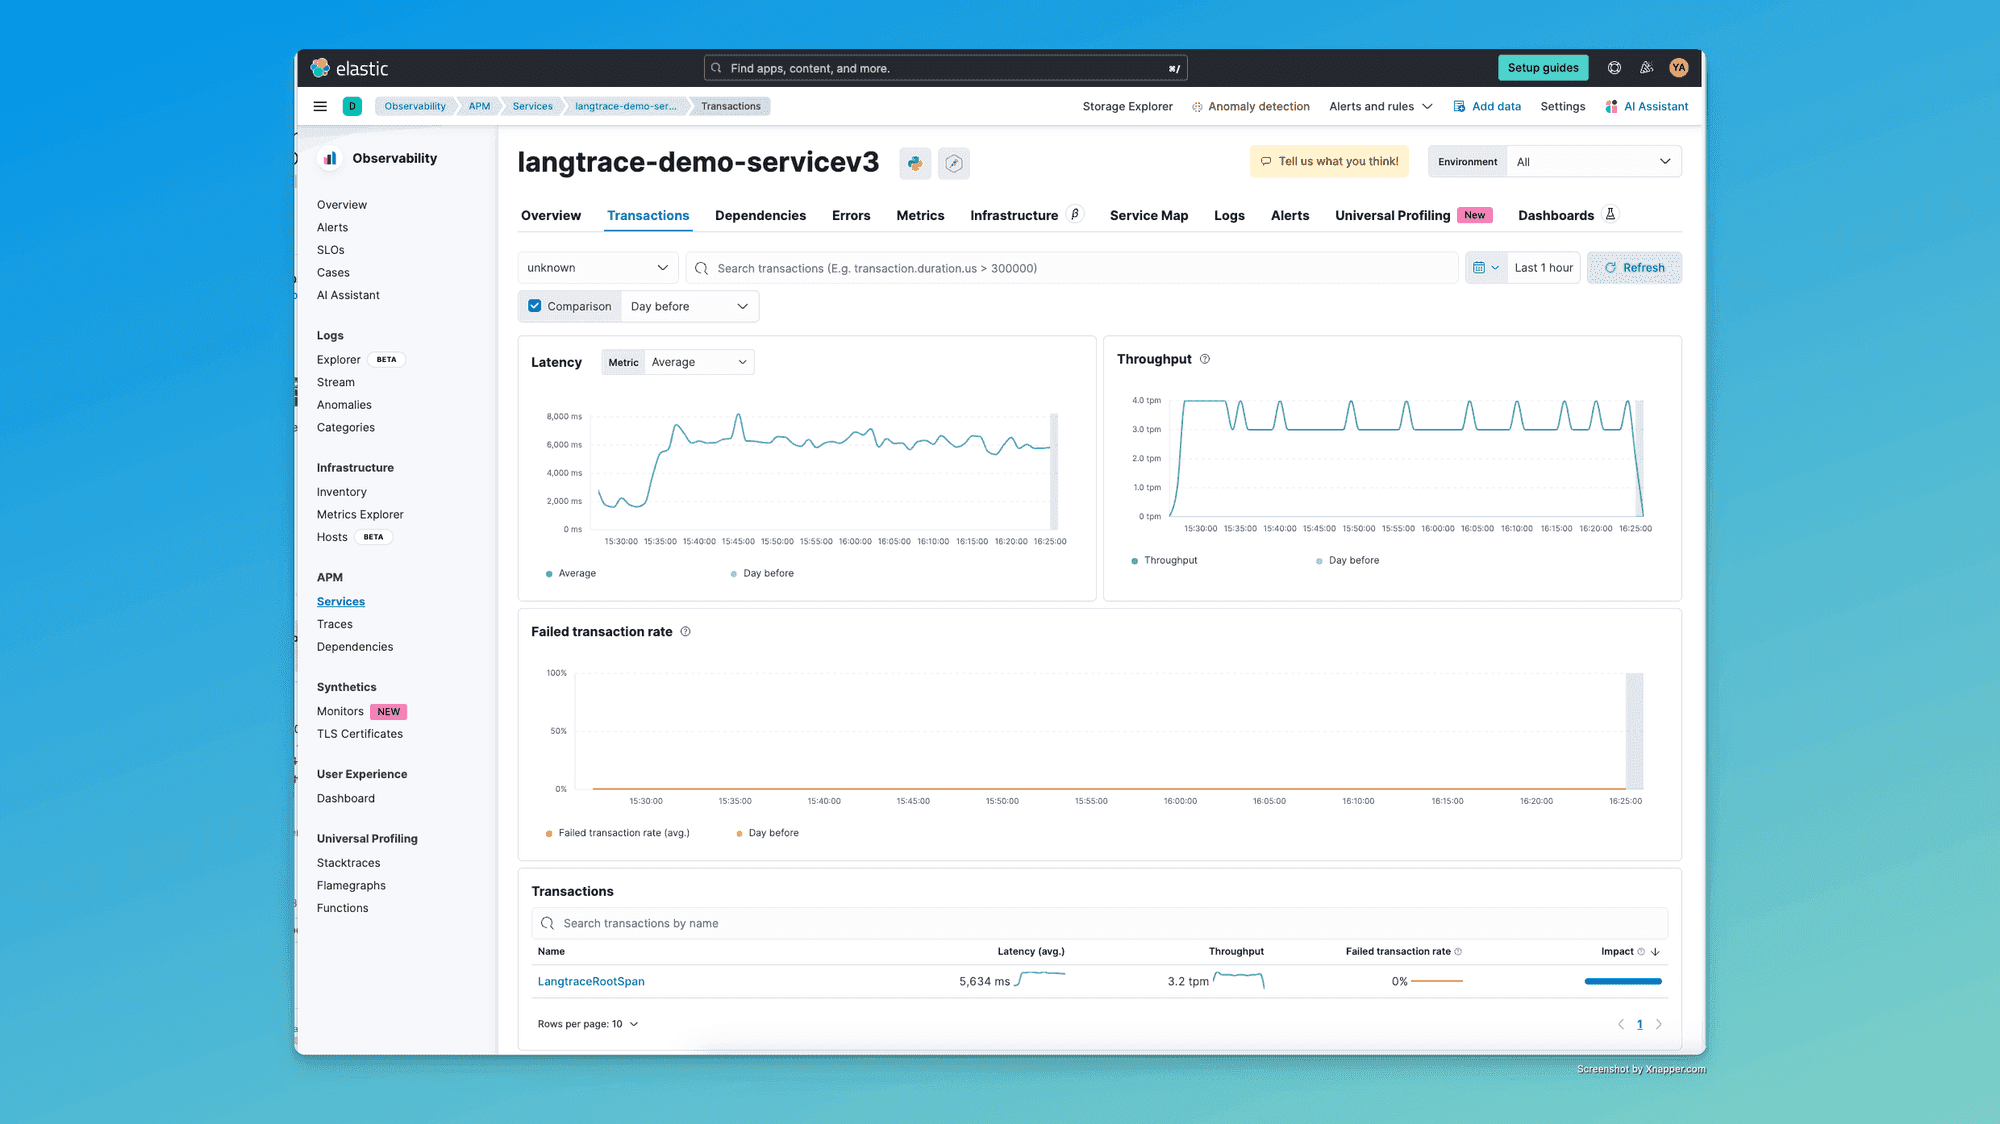
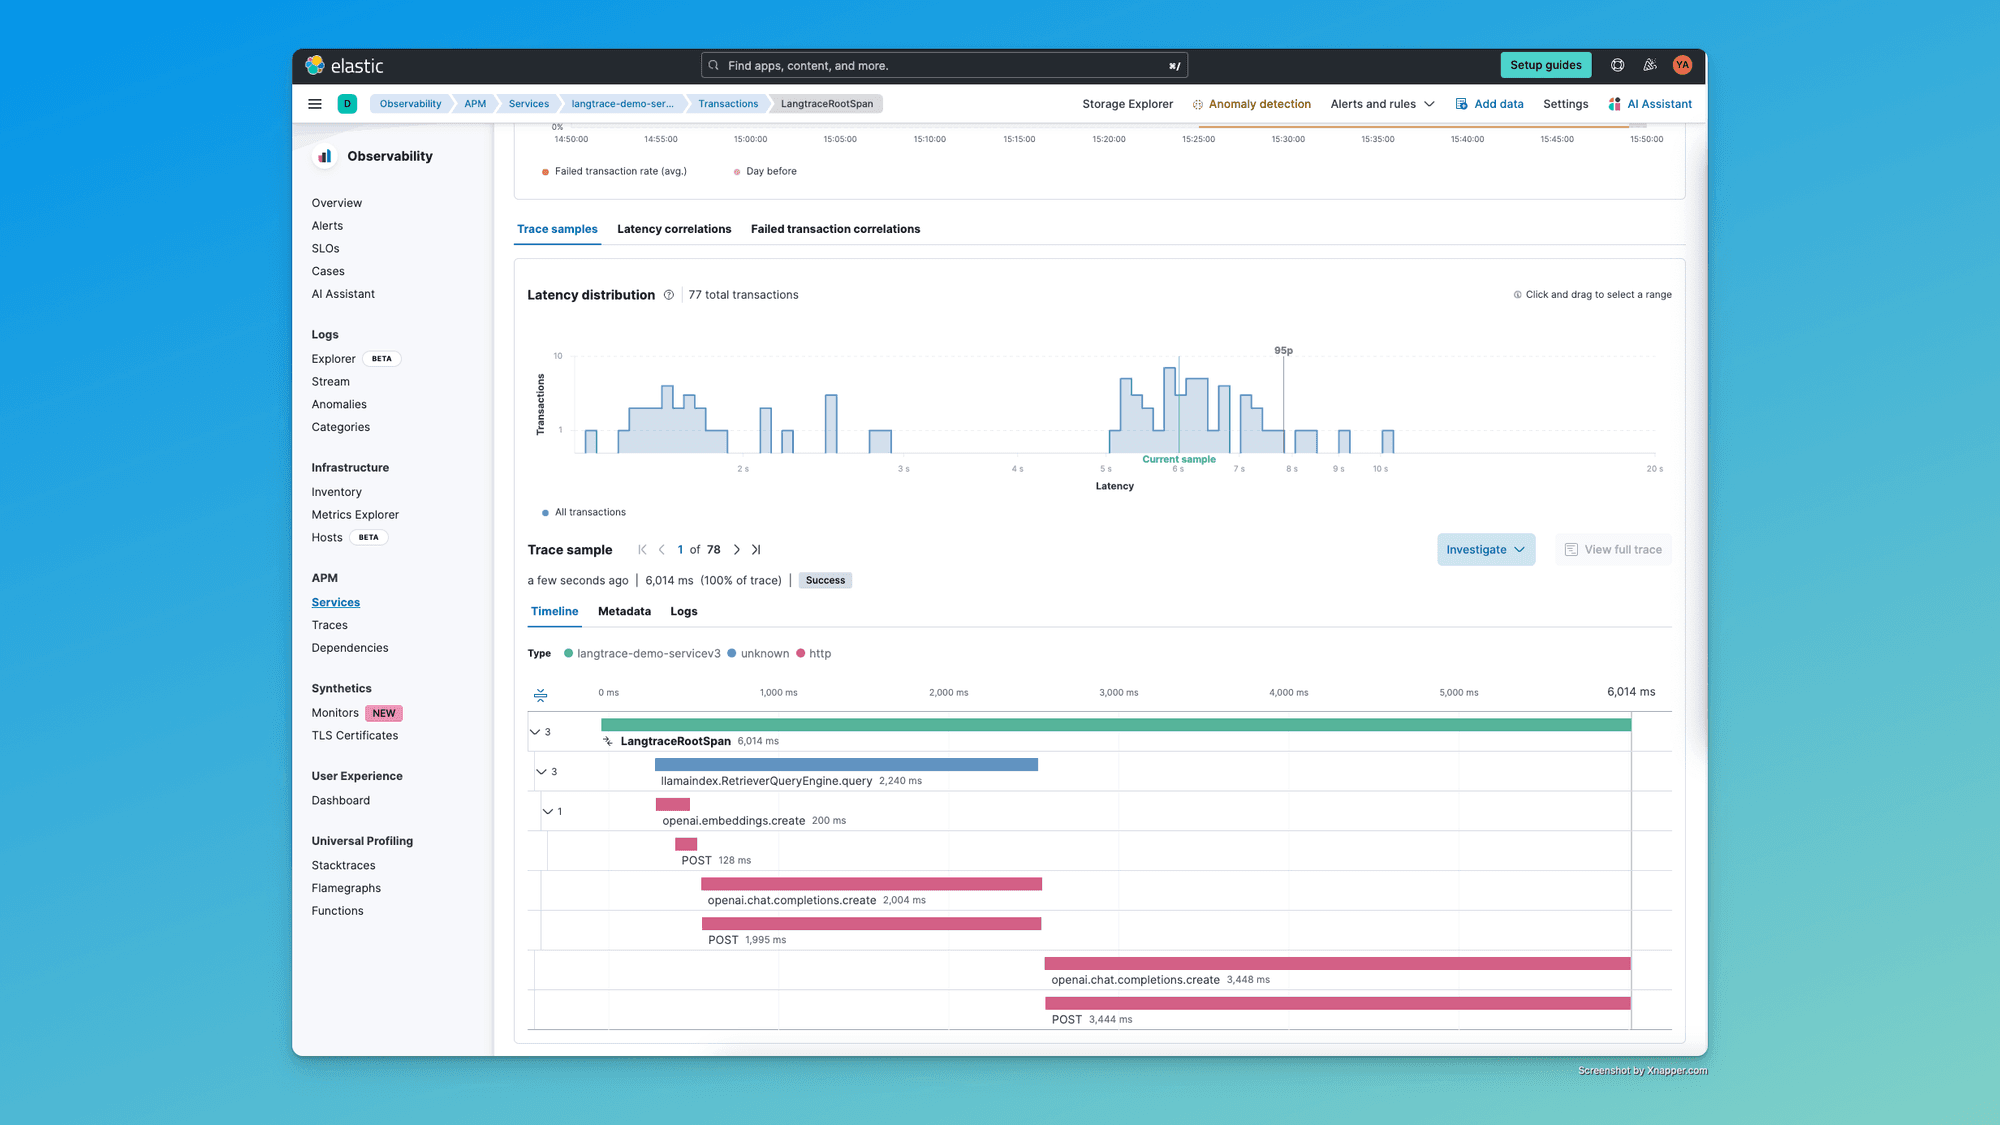
Verifying the Setup
Once the application is running, you should see the output of your query printed to the console. Additionally, you should see traces in your Elastic APM dashboard corresponding to the operations performed in your script. This integration is made possible due to Langtrace's support for OpenTelemetry, which enables seamless tracing and observability.
Conclusion
In this blog post, we demonstrated how to use Langtrace to send traces to Elastic APM and how to index and query data using LlamaIndex. By integrating Langtrace with your Python/Typescript application and configuring OpenTelemetry, you can gain valuable insights into the behavior and performance of your AI applications. We encourage you to try this setup in your projects and explore the powerful observability features provided by Elastic APM.
Join our Discord and let us know if we can help in any way.
Ready to deploy?
Try out the Langtrace SDK with just 2 lines of code.
Want to learn more?
Check out our documentation to learn more about how langtrace works
Join the Community
Check out our Discord community to ask questions and meet customers