Integrate Langtrace with Datadog

Karthik Kalyanaraman
⸱
Cofounder and CTO
Oct 17, 2024

Introduction
From day 1, we wanted to build an Observability solution that is,
Opensource
OpenTelemetry compatible
Prevents vendor lock-in
As a result of these early design decisions, developers today have the choice of using Langtrace's opentelemetry based tracing SDKs with any observability tool of their choice. In this post, we show case how you can use Langtrace for tracing your GenAI stack with Datadog
Setup
Ensure you have a [Datadog](https://datadoghq.com/) account
Install Langtrace SDK
In your OpenTelemetry collector setup, make sure you have the collector endpoint environment variable in
.envset like this example:
Initialize the Langtrace SDK in your application with your OTLP collector endpoint:
Note: The OTLP collector is setup using a config file in this example. The config file is shown below:
With the environment variables set, run your application with OpenTelemetry instrumentation. Use the following command:
Note: Make sure your collector is running and configured correctly. To run the collector locally, you can use the following command:
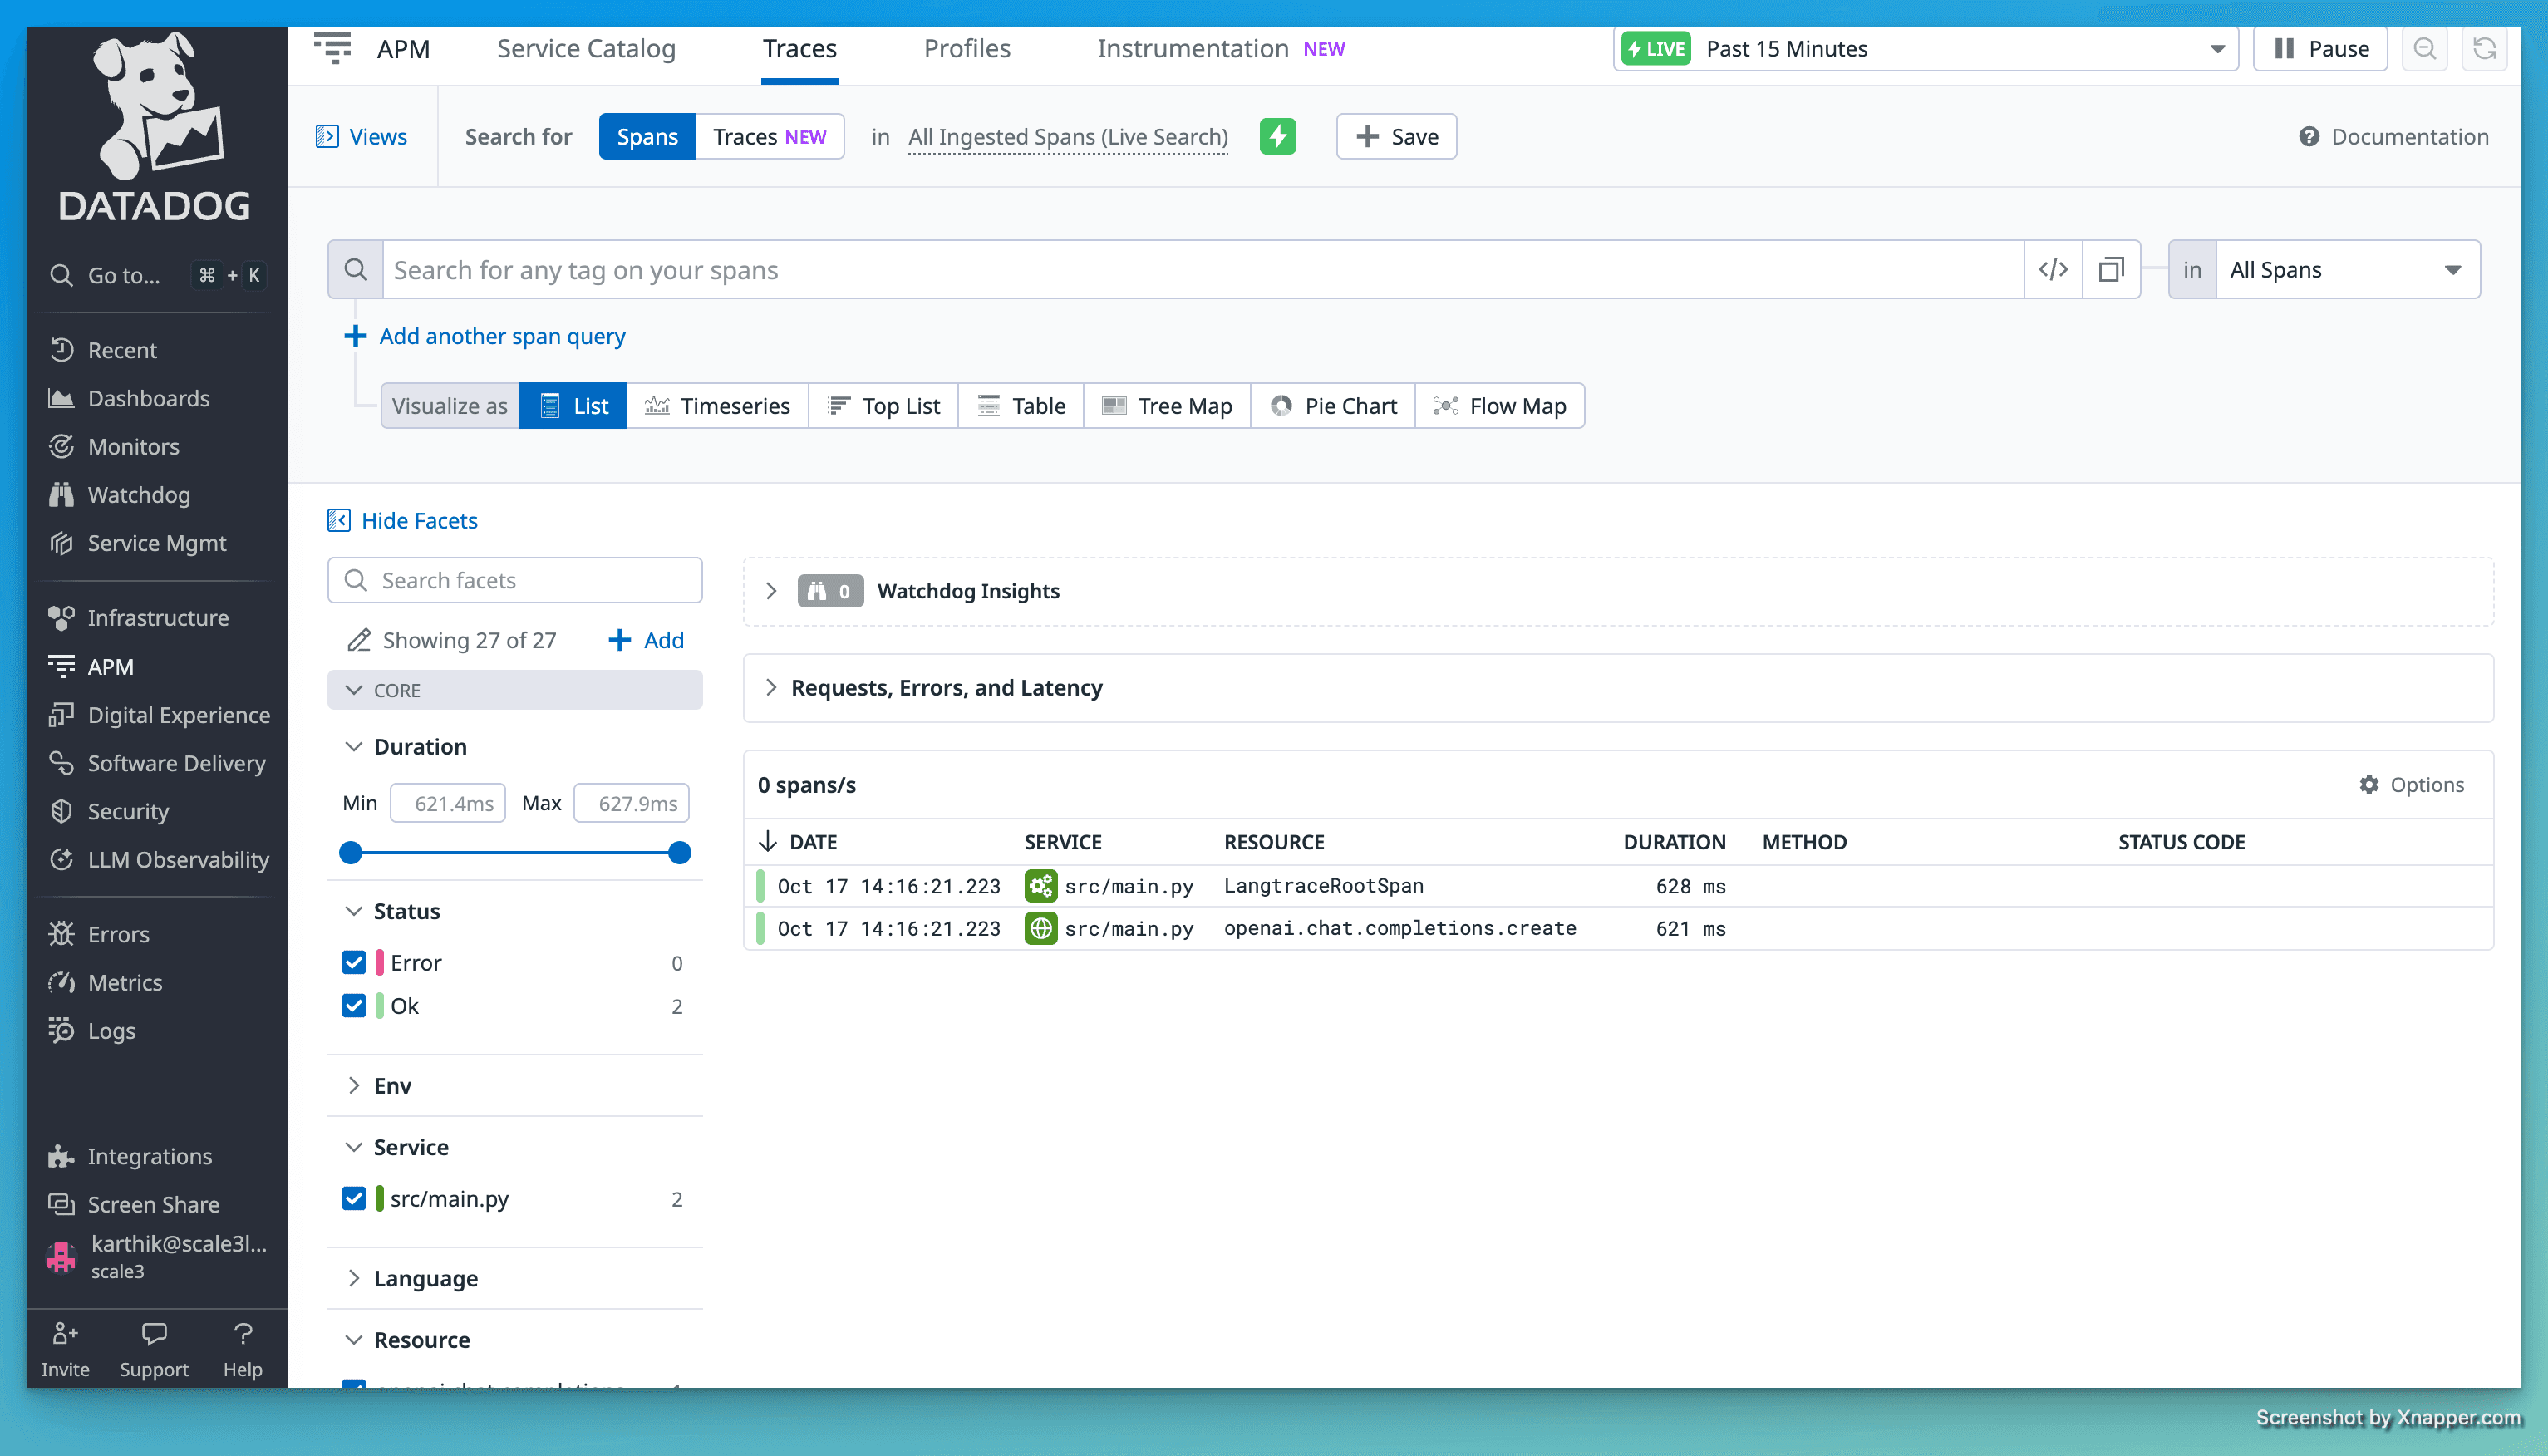
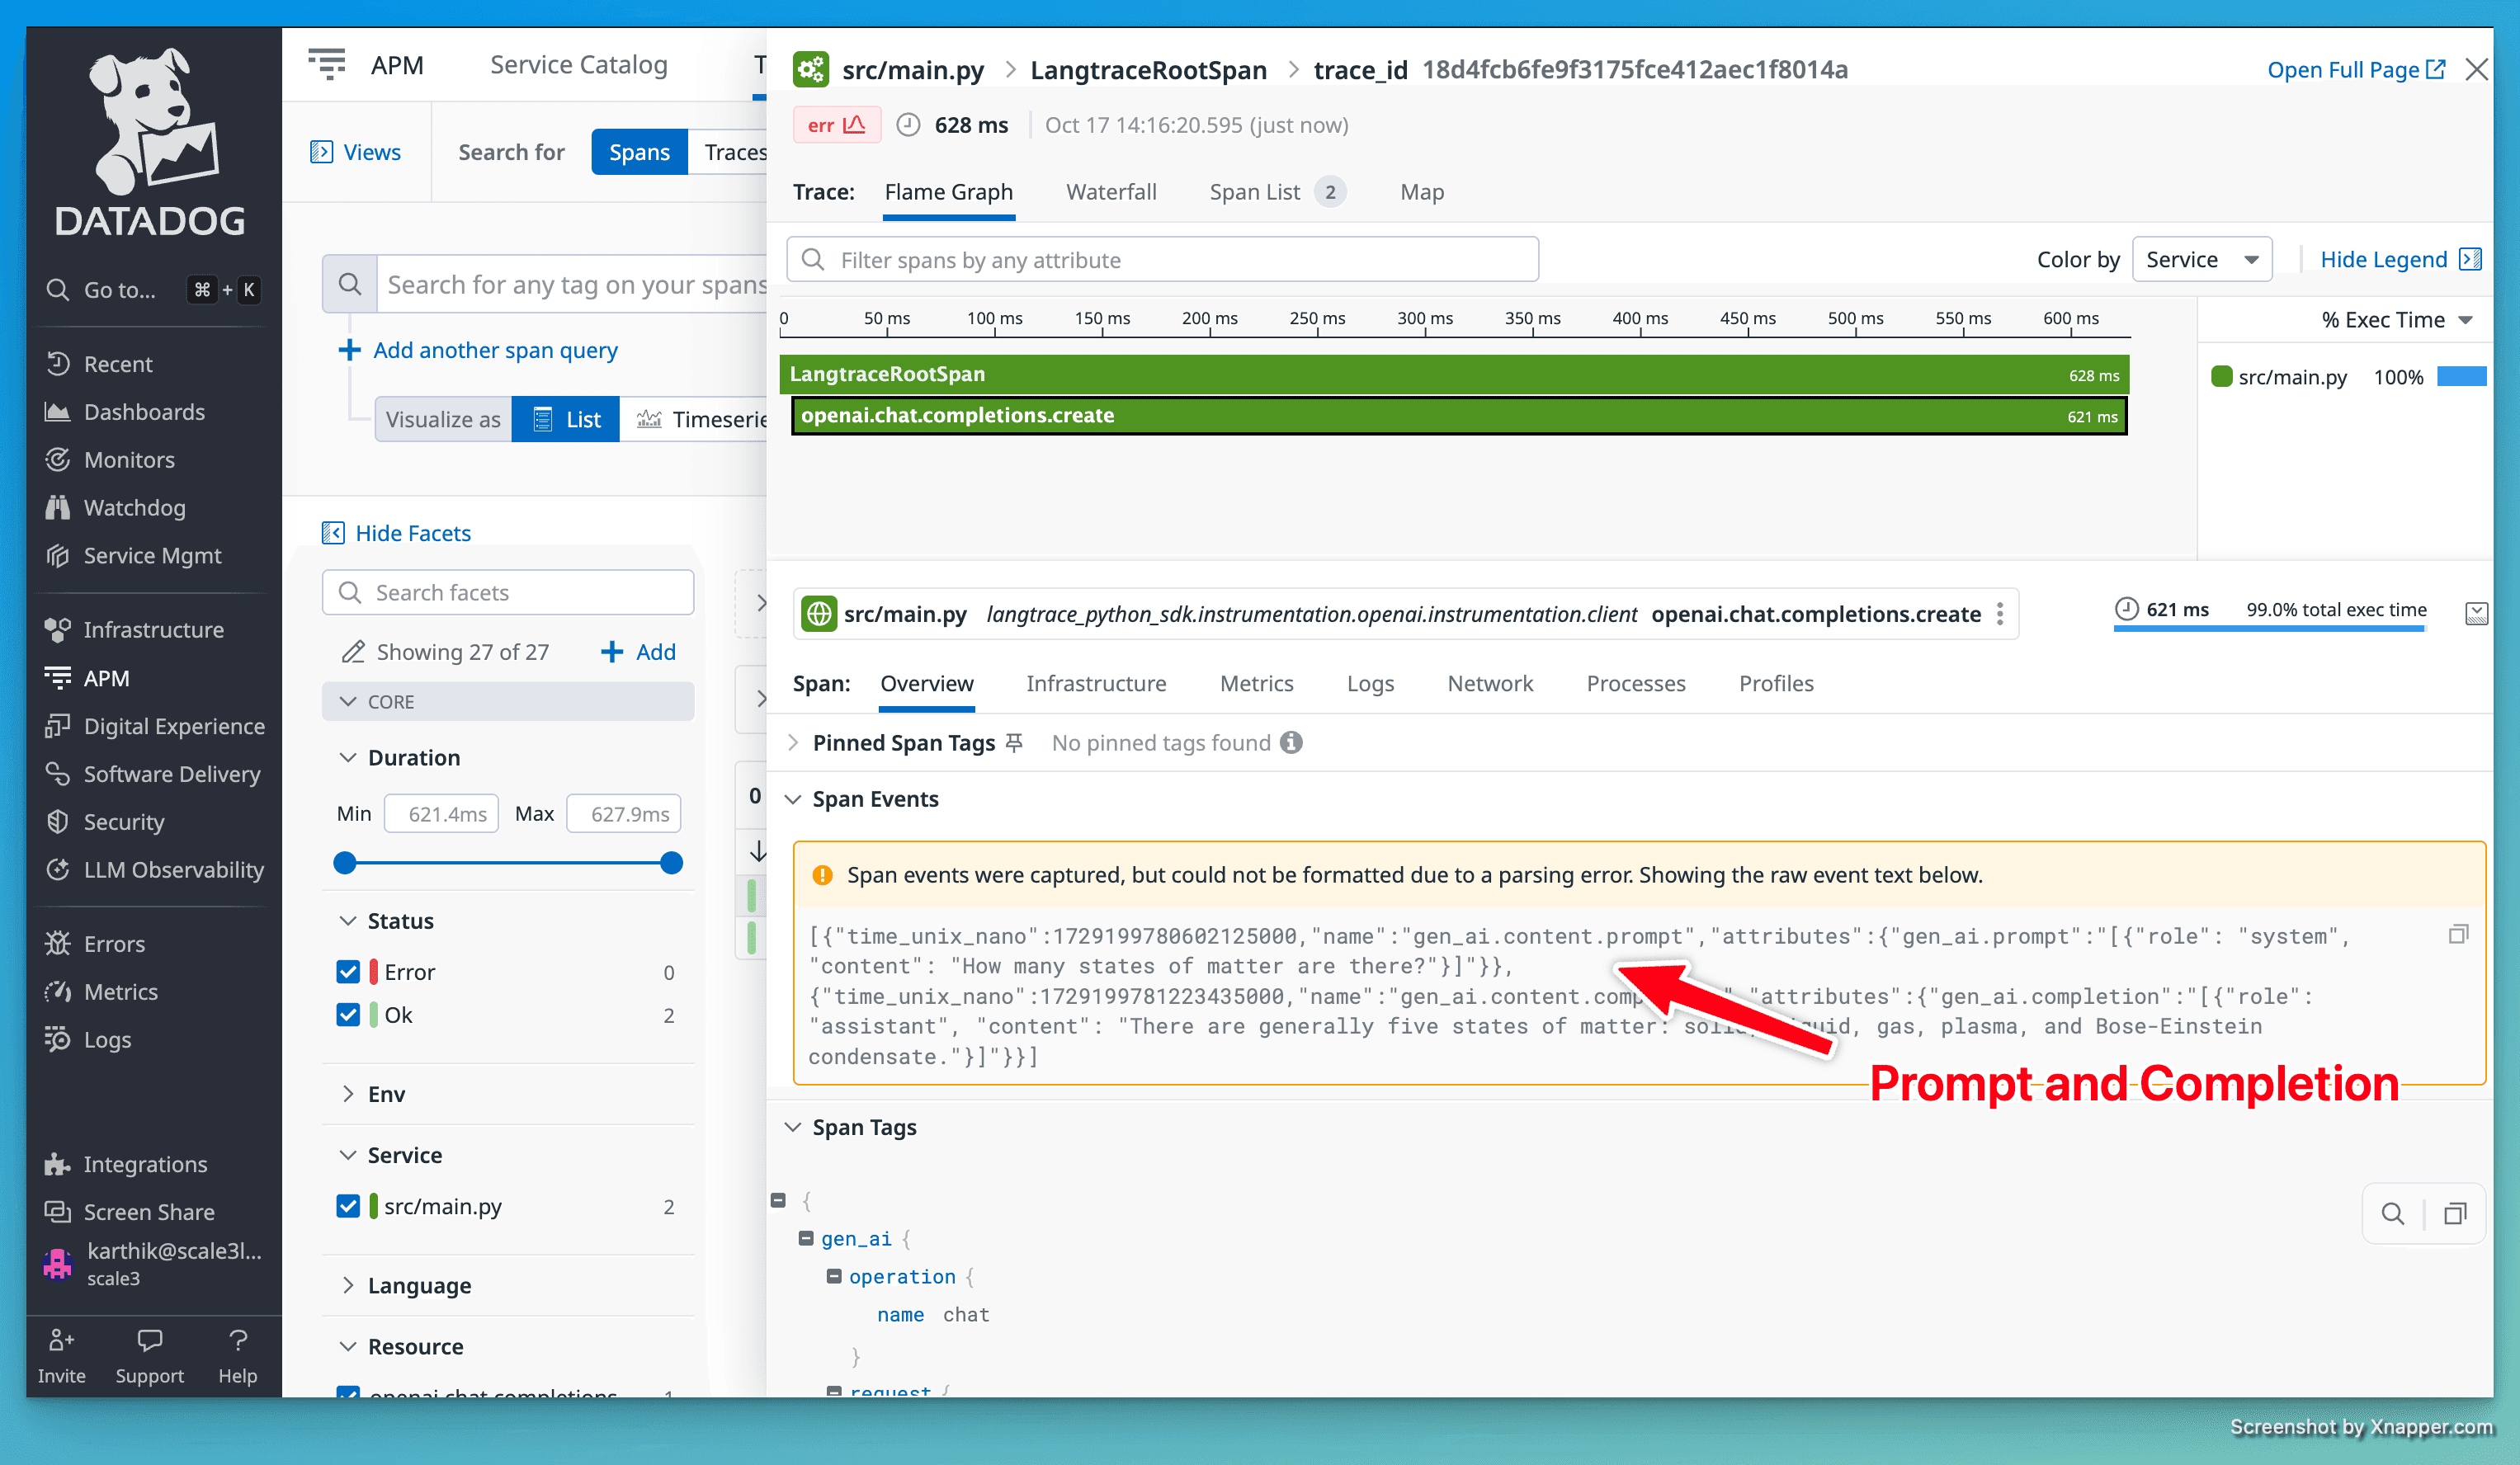
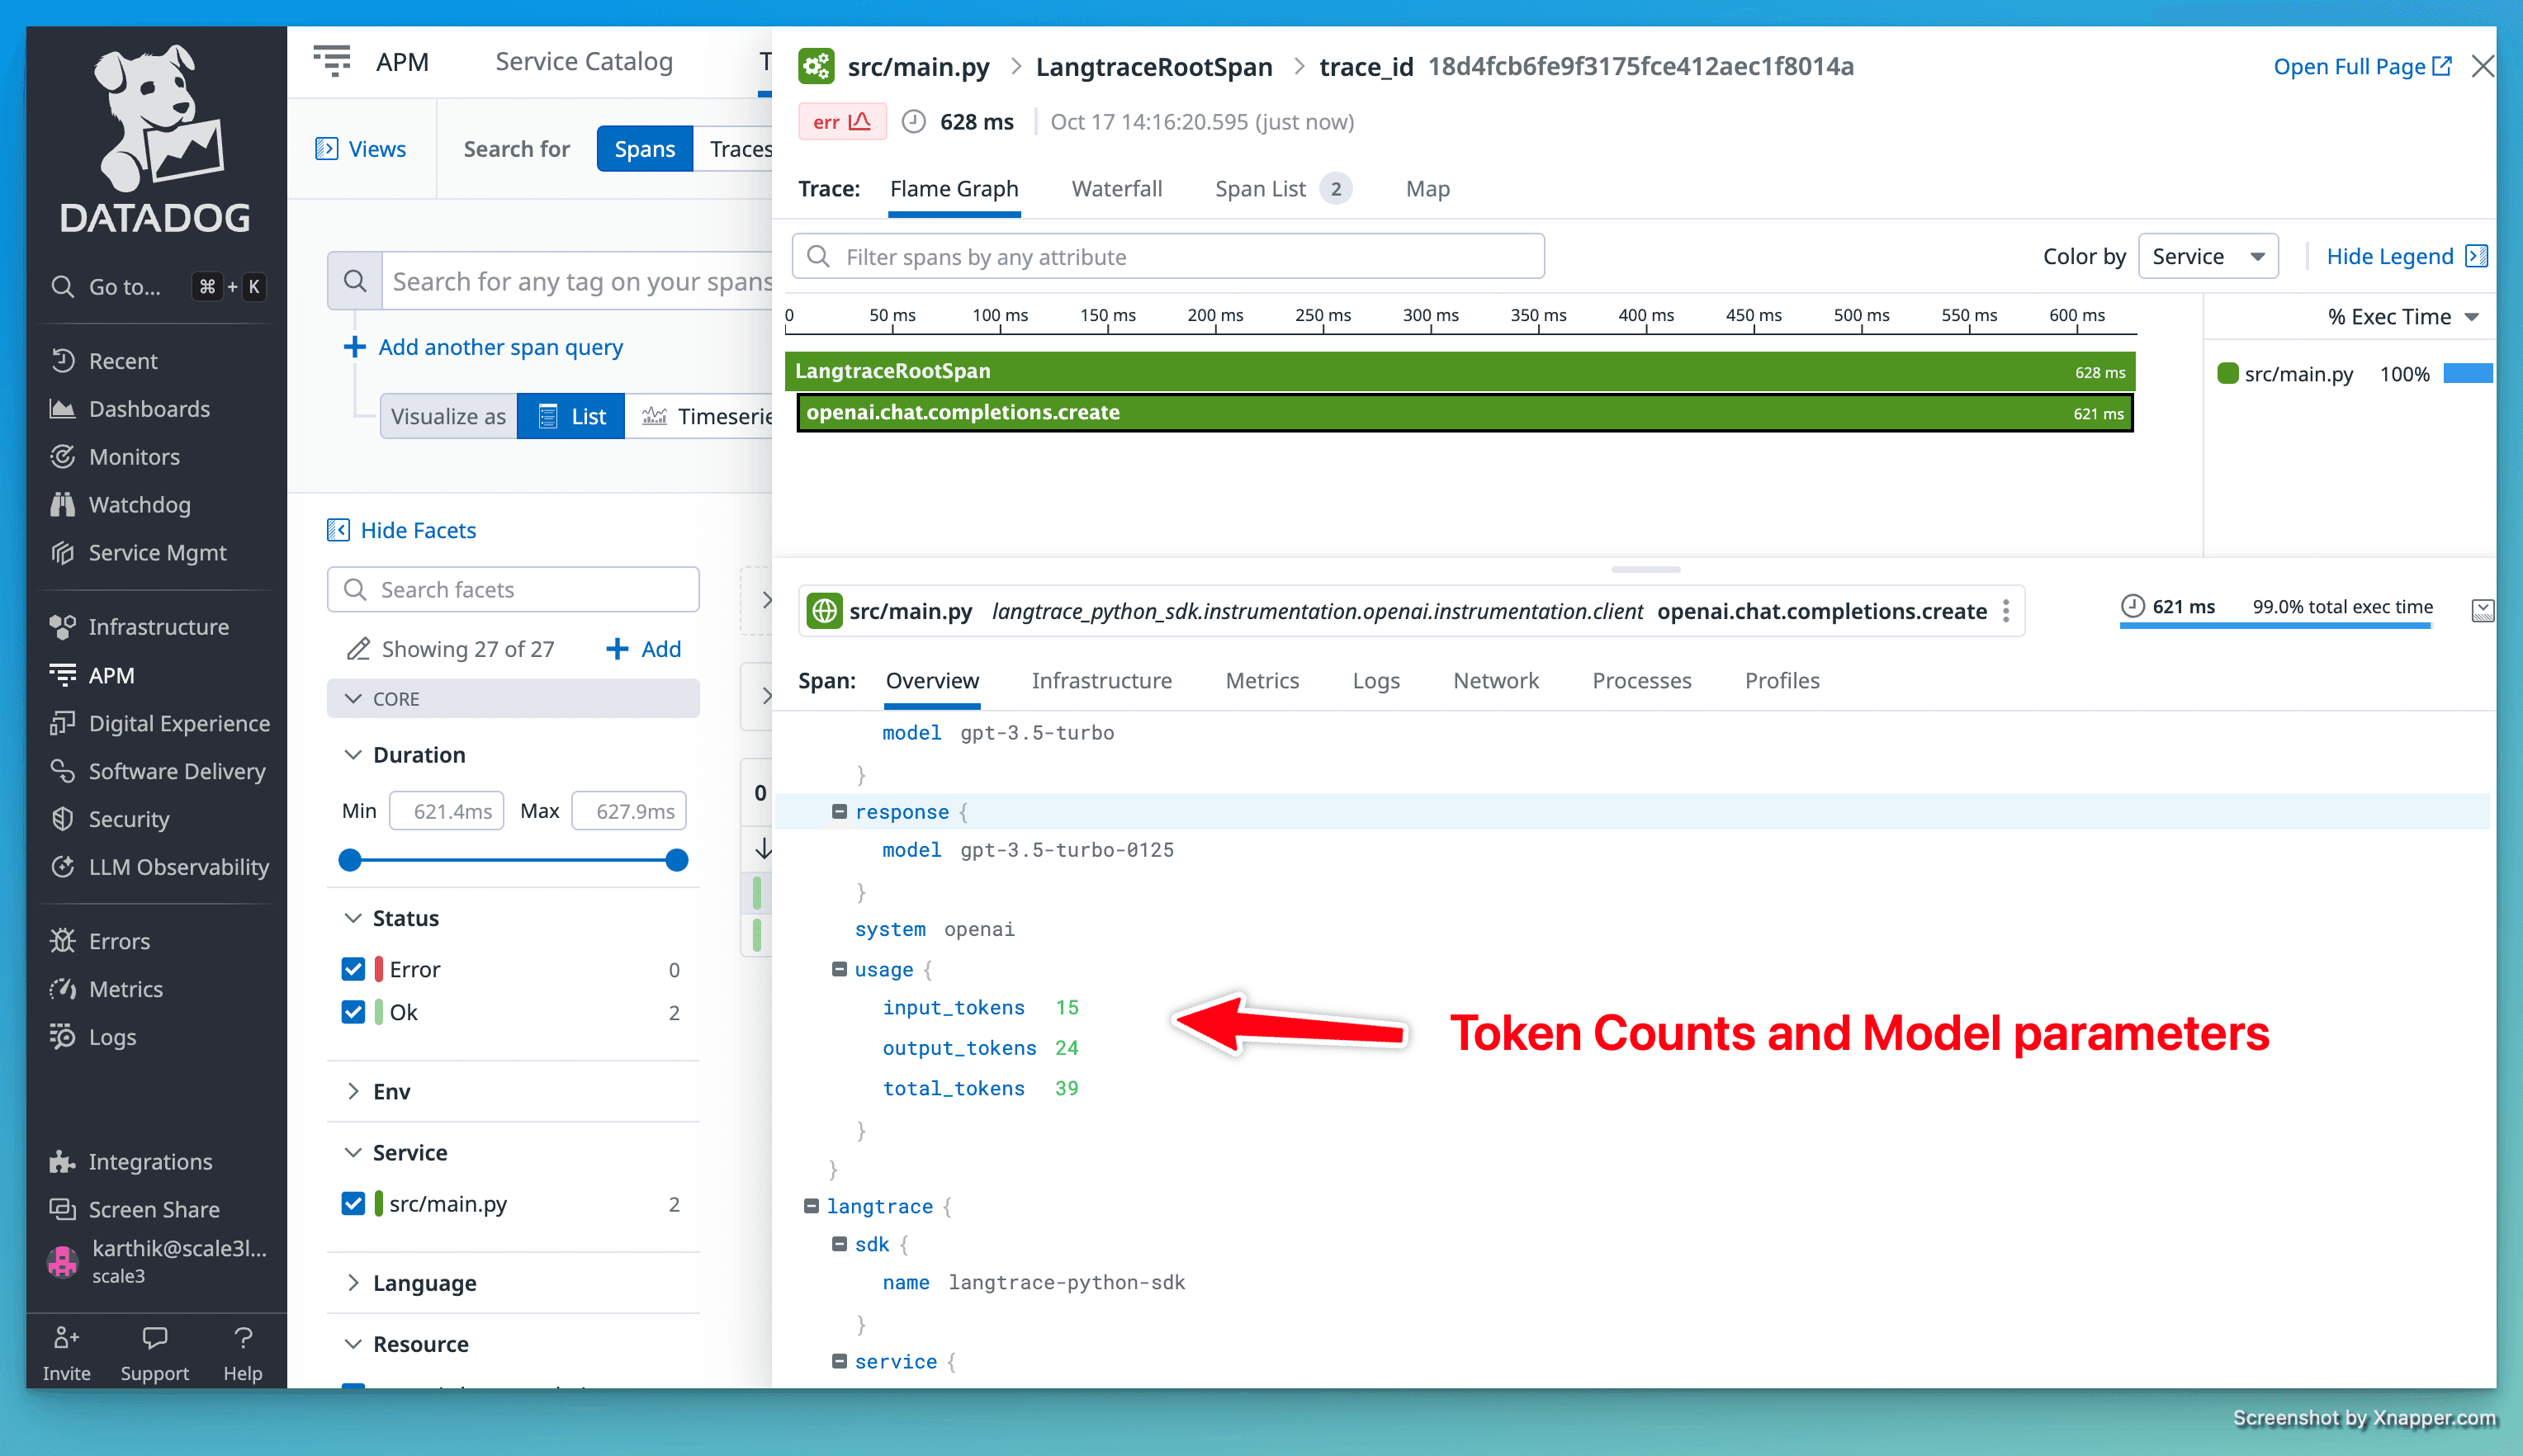
Once the application is running, you should see traces in your Datadog APM dashboard as shown below:
For more information check out our docs here - https://docs.langtrace.ai/supported-integrations/observability-tools/datadog
Useful Resources
Getting started with Langtrace https://docs.langtrace.ai/introduction
Datadog OpenTelemetry Documentation https://docs.datadoghq.com/opentelemetry/
Langtrace Website https://langtrace.ai/
Langtrace Discord https://discord.langtrace.ai/
Langtrace Github https://github.com/Scale3-Labs/langtrace
Langtrace Twitter(X) https://x.com/langtrace_ai
Langtrace Linkedin https://www.linkedin.com/company/langtrace/about/
Ready to deploy?
Try out the Langtrace SDK with just 2 lines of code.
Want to learn more?
Check out our documentation to learn more about how langtrace works
Join the Community
Check out our Discord community to ask questions and meet customers