How to Trace LLM Calls with Grafana

Tobi A
⸱
Project Manager
Jun 25, 2024

Introduction
Understanding how to effectively trace and observe LLM calls is crucial for optimizing performance, managing costs, and ensuring the reliability of your AI-powered applications. This blog post will guide you through the process of tracing LLM calls using Grafana Cloud and langtrace.ai.
Before we dive in, make sure you have these prerequisites
1. A Grafana Cloud account
2. A langtrace.ai account (optional for sending traces to Grafana)
Step 1: Create your environment
Create a python environment:
Step 2: Set Up Grafana Cloud
1. Log in to your Grafana Cloud account.
2. Generate a Grafana API token by following this guide.
3. Note down the values for:
- OTEL_EXPORTER_OTLP_ENDPOINT
- OTEL_EXPORTER_OTLP_HEADERS
Step 3: Install Required Libraries
Install the latest release of the OpenTelemetry Python package:
Additionally, install the latest release of Langtrace:
Step 4: Configure Your Environment
Set the following environment variables, replacing the placeholders with your actual values:
Note: For Python, replace the space after "Basic" with "%20" in the OTEL_EXPORTER_OTLP_HEADERS variable.
Step 5: Install and Initialize langtrace.ai SDK
1. Install the langtrace.ai Python SDK:
2. Import and initialize the SDK in your code:
Note: In-order to send traces to Grafana you must not input your Langtrace API key
Step 6: Run Your Application
Use the OpenTelemetry Python automatic instrumentation tool to run your application:
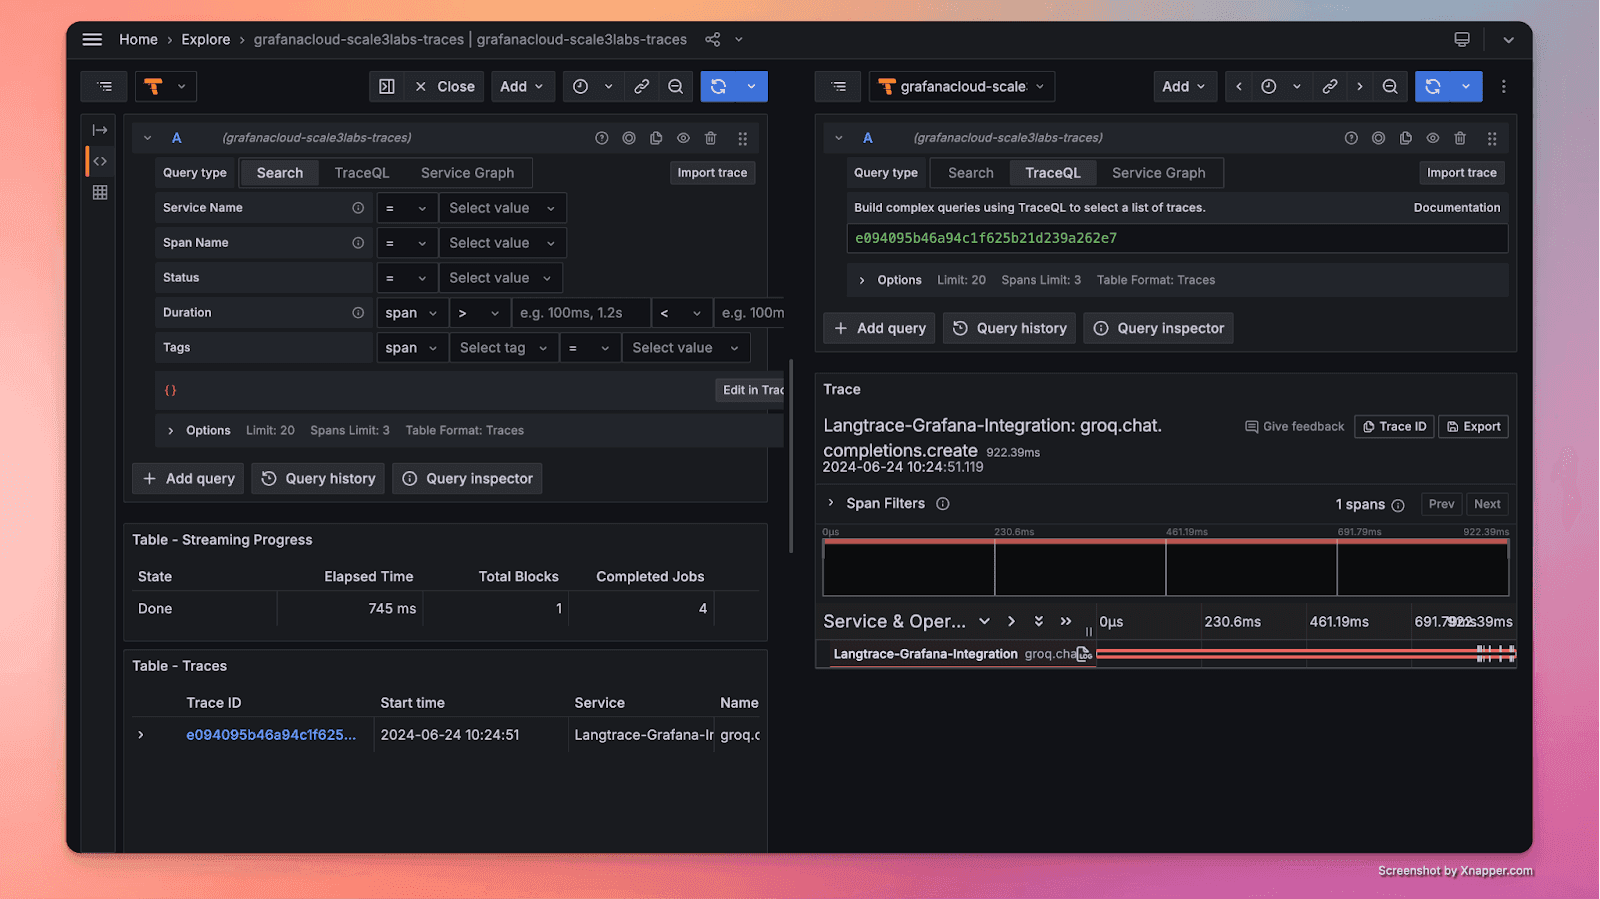
Step 7: Verify Traces in Grafana
After running your application, you should see traces generated in Grafana Tempo. You can now visualize and analyze the incoming requests and outgoing LLM calls made by your application.
Troubleshooting
If you encounter issues, try the following:
1. Traces not visible: Double-check all environment variables.
2. Missing libraries: Reinstall required packages:
3. OTEL_EXPORTER_OTLP_HEADERS formatting:
Ensure the space is replaced with "%20".
Use Case Examples: How-tos with Grafana
1. How to Debug LLM Response Latency Using Grafana:
Visualize latency trends using time series graphs.
Set up alerts for response times exceeding thresholds.
2. How to Optimize LLM Token Usage Using Grafana:
Track token consumption per request.
Identify high-token-consuming requests through query analysis.
3. How to Monitor LLM Error Rates with Grafana:
Create a panel to track different types of LLM errors (e.g., timeouts, API errors).
Use heatmaps to visualize error frequency across time periods.
Implement annotations to mark deployments or config changes for context.
4. How to Analyze LLM Prompt Effectiveness Using Grafana:
Correlate prompt variations with response quality metrics.
Compare different prompt strategies over time.
Use variables to easily switch between prompt categories.
5. How to Track LLM Cost Efficiency with Grafana:
Combine token usage with pricing data.
Calculate cost per successful interaction using math functions.
Create projections and alerts for budget thresholds.
6. How to Optimize LLM Caching Strategies Using Grafana:
Compare response times for cached vs. non-cached LLM calls.
Show cache hit rates using gauge panels.
Analyze which types of queries benefit most from caching.
These examples demonstrate how Grafana can be used to gain insights, improve performance, and optimize costs in LLM applications.
Additional Resources
For more information on integrating langtrace.ai with Grafana, check out our official langtrace.ai documentation:
To get started quickly, we've created a simple demo program that showcases the integration:
Visit our GitHub repository for more open-source LLM observability stack tools.
Stay up to date with Langtrace’s latest tooling updates via out Linkedin and Twitter:
We’d love to hear from you!
We’d love to hear your feedback, Langtrace! We invite you to join our community on Discord or reach out at support@langtrace.ai and share your experiences, insights, and suggestions. Together, we can continue to set new standards of observability in LLM development.
Happy tracing!
Ready to deploy?
Try out the Langtrace SDK with just 2 lines of code.
Want to learn more?
Check out our documentation to learn more about how langtrace works
Join the Community
Check out our Discord community to ask questions and meet customers